
Sprott Critical Materials ETF
Page Menu - SETM
As of March 28, 2025
NAV
$14.53
NAV Daily Change
-$0.43
 -2.87%
NAV Since Inception Cumulative Change1
-25.82%
Ticker
SETM
Market Price2
$14.50
Premium/Discount3
-0.21%
Total Net Asset Value
$36.2 Million
Net Total Expense Ratio4
0.65%
Overview
Key Points
- Pure-Play† Critical Materials ETF – Provides pure-play access to a range of critical materials necessary to meet the rising global demand for energy.
- Increased Demand Driving Growth – Global demand for electricity may rise 169% by 2050;†† as technological advancements gain momentum, middle classes grow globally, and nations pursue net-zero emissions goals.
- Substantial Opportunity for the Foreseeable Future – To meet the world’s energy demands and 2050 net-zero targets, global investment in energy is likely to increase trillions of dollars,††† given population growth, economic expansion and technological advancements.
- Well-Positioned Companies – Companies upstream in the supply chain may be well-positioned to benefit from the increased investment in the critical materials necessary to meet rising global demand for electricity.
Investment Objective
Sprott Critical Materials ETF (Nasdaq: SETM) seeks to provide investment results that, before fees and expenses, correspond generally to the total return performance of the Nasdaq Sprott Critical Materials™ Index (NSETM™). The Index is designed to track the performance of a selection of global securities in the energy transition materials industry.
†The term “pure-play” relates directly to the exposure that the Fund has to the total universe of investable, publicly listed securities in the investment strategy.
††Source: IEA World Energy Outlook 2024, net-zero emissions scenario.
†††Energy Transition Investment Trends 2024, BloombergNEF.
Effective October 1, 2024, Sprott Energy Transition Materials ETF changed its name to Sprott Critical Materials ETF. The Fund's underlying index, the Nasdaq Sprott Energy Transition Materials™ Index, changed its name to the Nasdaq Sprott Critical Materials™ Index. The Fund's investment objective, the Index's selection methodology, and both tickers, remain the same.
Key Facts
Ticker
SETM
Listing Exchange
Nasdaq®
Benchmark Index
NSETM
Index Rebalance Frequency
Semi-Annually in June & December
ISIN
Show ISIN
ISIN: US85208P4028
Copyright 2025, American Bankers Association. CUISP Database provided by FactSet Research Systems Inc. All rights reserved.
CUSIP
Show CUSIP
CUSIP: 85208P402
Copyright 2025, American Bankers Association. CUISP Database provided by FactSet Research Systems Inc. All rights reserved.
Inception Date
February 1, 2023
Adviser
Sprott Asset Management USA, Inc.
Sub-Adviser
ALPS Advisors, Inc.
Distributor
ALPS Distributors, Inc.
Fees & Expenses4
| Management Fee | 0.65% |
| Other Expenses | 0.00% |
| Total Annual Fund Operating Expenses | 0.65% |
ETF Fund Details
March 27, 2025
Total Net Assets
$36,187,983.04
Shares Outstanding
2,490,000
Number of Holdings
95
Median 30 Day Bid Ask Spread
(As of 3/27/2025)
0.51%
Performance
Month-End Performance
Average Annual Total Returns (%) As of 2/28/2025
| Fund | 1 MO* | 3 MO* | YTD* | 1 YR | S.I.*1 |
| Sprott Critical Materials ETF (Net Asset Value) |
-6.16 | -16.38 | -3.79 | -9.07 | -13.56 |
| Sprott Critical Materials ETF (Market Price)2 |
-5.78 | -16.43 | -3.46 | -8.99 | -13.44 |
| Nasdaq Sprott Critical Materials™� Index (Benchmark)5 |
-6.14 | -16.18 | -3.64 | -8.61 | -12.66 |
| S&P 500 Total Return Index (S&P 500 Index)5 |
-1.30 | -0.97 | 1.44 | 18.41 | 21.25 |
| MSCI All Country World Index5 | -0.60 | 0.30 | 2.73 | 15.06 | 16.14 |
Quarter-End Performance
Average Annual Total Returns (%) As of 12/31/2024
| Fund | 1 MO* | 3 MO* | YTD* | 1 YR | S.I.*1 |
| Sprott Critical Materials ETF (Net Asset Value) |
-13.09 | -14.25 | -13.09 | -13.09 | -12.87 |
| Sprott Critical Materials ETF (Market Price)2 |
-13.44 | -14.78 | -13.49 | -13.49 | -12.90 |
| Nasdaq Sprott Critical Materials™� Index (Benchmark)5 |
-13.02 | -14.42 | -12.78 | -12.78 | -11.96 |
| MSCI All Country World Index5 | -2.37 | -0.99 | 17.49 | 17.49 | 15.97 |
Performance data quoted represents past performance. Past performance does not guarantee future results. Current performance may be higher or lower than actual data quoted. Call 888.622.1813 or visit www.sprottetfs.com for current month end performance. The investment return and principal value of an investment will fluctuate so that an investor’s shares, when redeemed, may be worth more or less than their original cost.
* Returns less than one year are not annualized.
1 Inception Date: 2/1/2023.
2 Market Price is based on the midpoint of the bid/ask spread at 4 p.m. ET and does not represent the returns an investor would receive if shares were traded at other times.
3 The Premium/Discount is the amount (stated in dollars or percent) by which the selling or purchase price of an ETF is greater than (premium) or less than (discount) its face amount/value or net asset value (NAV).
4 Reflects Total Annual Operating Expenses as outlined in the most recent prospectus. For the services the Adviser (Sprott Asset Management USA, Inc.) provides to the Fund, the Adviser is entitled to receive an annual advisory fee from the Fund calculated daily and paid monthly at an annual rate of 0.65% of net assets.
5 The Nasdaq Sprott Critical Materials™ Index (NSETM™) was co-developed by Nasdaq® (the “Index Provider”) and Sprott Asset Management LP (the “Sponsor”). The Index Provider and Sponsor co-developed the methodology for determining the securities to be included in the Index and the Index Provider is responsible for the ongoing maintenance of the Index. The Sponsor will provide certain services in connection with the Index including contributing inputs in connection with the eligibility and process to determine the initial selection and ongoing composition of the Index constituents.
Market Price vs. Net Asset Value Since Inception
User Options: Mouse over the graph to view detailed daily values; click and drag your mouse to choose specific time frames. Click on the "Reset Zoom" button to return to the full timeline view.
Inception date: February 01, 2023.
Historical Premium/Discount: Market Price to Net Asset Value
User Options: Mouse over the graph to view detailed daily values; click and drag your mouse to choose specific time frames. Click on the "Reset Zoom" button to return to the full timeline view.
Inception date: February 01, 2023.
Frequency Distribution: Premium/Discount
Trading Days Each Quarter
Data updated as of March 31, 2025
| CY 2024 | Q1 2025 | Q2 2025 | Q3 2025 | Q4 2025 | |
| Days Traded at Premium | 164 | 47 | -- | -- | -- |
| Days Traded at Discount | 72 | 9 | -- | -- | -- |
Portfolio Characteristics
As of 2/28/2025
| Number of Issuers | 95 |
| Market Cap (millions) | $374,728.28 |
| Weighted Avg. Company Market Cap (millions) | $10,241.33 |
| Market Cap Breakdown | |
| Large (>$10B) | 28.82% |
| Medium ($2 -$10B) | 40.09% |
| Small (<$2B) | 31.09% |
| Material Weightings††† | |
| Copper Equities | 26.16% |
| Lithium Equities | 24.44% |
| Uranium Equities | 21.72% |
| Rare Earths Equities | 12.63% |
| Silver Equities | 8.77% |
| Nickel Equities | 3.46% |
| Manganese Equities | 1.99% |
| Graphite Equities | 0.41% |
| Other | 0.00% |
| Recycling Equities | 0.42% |
| Cobalt Equities | 0.00% |
††† Reflects equities classified by Sprott Asset Management.
Company Domicile Breakdown
As of 2/28/2025
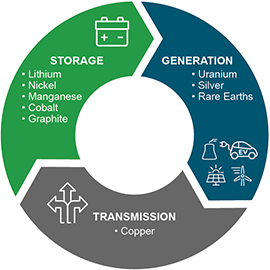
Critical Materials: Natural materials that are essential to the generation, transmission and storage of clean energy. SETM provides investors access to the miners who produce uranium, lithium, copper, nickel, silver, manganese, cobalt, graphite and rare earth elements.
Holdings
As of 3/27/2025
| Security | Market Value | Symbol | SEDOL | Quantity | Weight |
|---|---|---|---|---|---|
| MP Materials Corp. | $2,580,519.02 | MP | BN15Y35 | 98,606 | 6.93% |
| Sociedad Quimica y Minera de Chile SA | $2,191,522.90 | SQM | 2771122 | 54,005 | 5.88% |
| Lynas Rare Earths Ltd. | $2,129,352.48 | LYC AU | 6121176 | 463,565 | 5.72% |
| Freeport-McMoRan Inc. | $1,879,060.00 | FCX | 2352118 | 47,000 | 5.05% |
| Pilbara Minerals Ltd. | $1,555,475.76 | PLS AU | B2368L5 | 1,334,388 | 4.18% |
| Teck Resources Ltd. | $1,523,453.40 | TECK | 2124533 | 38,745 | 4.09% |
| Cameco Corp. | $1,489,961.13 | CCJ | 2158684 | 34,951 | 4.00% |
| Albemarle Corp. | $1,443,422.50 | ALB | 2046853 | 19,310 | 3.88% |
| NAC Kazatomprom JSC | $1,230,135.30 | KAP LI | BGXQL36 | 36,941 | 3.30% |
| Uranium Energy Corp. | $1,119,565.23 | UEC | B0VLLY2 | 219,093 | 3.01% |
| IGO Ltd. | $1,028,176.49 | IGO AU | 6439567 | 390,375 | 2.76% |
| Antofagasta PLC | $993,423.24 | ANTO LN | 0045614 | 43,159 | 2.67% |
| MAG Silver Corp. | $991,979.50 | MAG | B01CJZ2 | 59,650 | 2.66% |
| Southern Copper Corp. | $943,221.60 | SCCO | 2823777 | 9,740 | 2.53% |
| First Quantum Minerals Ltd. | $914,770.06 | FM CN | 2347608 | 62,486 | 2.46% |
| Aya Gold & Silver Inc. | $875,205.42 | AYA CN | BK94091 | 97,696 | 2.35% |
| Ganfeng Lithium Group Co. Ltd. | $780,135.41 | 1772 HK | BZ9NS11 | 274,500 | 2.09% |
| NexGen Energy Ltd. | $741,995.62 | NXE | BCH0BB4 | 153,941 | 1.99% |
| Denison Mines Corp. | $714,553.13 | DNN | B0122F3 | 514,067 | 1.92% |
| Endeavour Silver Corp. | $608,367.84 | EXK | B018TM7 | 133,414 | 1.63% |
| Lundin Mining Corp. | $546,015.72 | LUN CN | 2866857 | 63,167 | 1.47% |
| Sigma Lithium Corp. | $539,437.30 | SGML | BNM4ZD8 | 46,745 | 1.45% |
| Ivanhoe Mines Ltd. | $502,611.36 | IVN CN | BD73C40 | 51,266 | 1.35% |
| Silvercorp Metals Inc. | $502,125.40 | SVM | B01DQT8 | 121,580 | 1.35% |
| KGHM Polska Miedz SA | $465,709.21 | KGH PW | 5263251 | 13,251 | 1.25% |
| Energy Fuels Inc. | $456,816.72 | UUUU | BFV4XW8 | 113,636 | 1.23% |
| Eramet SA | $449,825.13 | ERA FP | 4017017 | 7,717 | 1.21% |
| Capstone Copper Corp. | $443,299.61 | CS CN | BMY5XY9 | 78,030 | 1.19% |
| Nickel Industries Ltd. | $394,943.57 | NIC AU | BZ7NDP2 | 1,010,960 | 1.06% |
| Amman Mineral Internasional PT | $323,587.33 | AMMN IJ | BRK2Z98 | 996,950 | 0.87% |
| Paladin Energy Ltd. | $313,328.38 | PDN AU | 6668468 | 88,012 | 0.84% |
| CGN Mining Co. Ltd. | $293,194.45 | 1164 HK | B755514 | 1,499,950 | 0.79% |
| Tianqi Lithium Corp. | $290,208.84 | 9696 HK | BMZ3RS4 | 91,550 | 0.78% |
| Hudbay Minerals Inc. | $275,064.00 | HBM | B05BQ98 | 34,383 | 0.74% |
| Vizsla Silver Corp. | $267,310.12 | VZLA | BSB7Q07 | 113,267 | 0.72% |
| Cia de Minas Buenaventura SAA | $264,245.65 | BVN | 2210476 | 16,735 | 0.71% |
| Liontown Resources Ltd. | $251,061.16 | LTR AU | B1J89V5 | 603,707 | 0.67% |
| Vale Indonesia Tbk PT | $246,348.46 | INCO IJ | B0217K9 | 1,797,150 | 0.66% |
| Merdeka Battery Materials Tbk PT | $246,451.09 | MBMA IJ | BMBR1M2 | 13,604,100 | 0.66% |
| MOIL Ltd. | $210,964.58 | MOIL IN | B4NRBT1 | 55,110 | 0.57% |
| Lithium Americas Corp. | $198,761.85 | LAC | BQ2LQL5 | 69,255 | 0.53% |
| Arafura Rare Earths Ltd. | $184,629.05 | ARU AU | 6711726 | 1,542,187 | 0.50% |
| Deep Yellow Ltd. | $169,182.56 | DYL AU | 6480275 | 253,303 | 0.45% |
| GoGold Resources Inc. | $168,066.10 | GGD CN | B60BNP0 | 132,879 | 0.45% |
| Boss Energy Ltd. | $158,535.30 | BOE AU | B1XLCQ6 | 99,448 | 0.43% |
| Sandfire Resources Ltd. | $161,139.95 | SFR AU | 6739739 | 22,895 | 0.43% |
| Ur-Energy Inc. | $154,895.25 | URG | B0WW4L2 | 214,210 | 0.42% |
| Vulcan Energy Resources Ltd. | $151,936.76 | VUL AU | BKYBH63 | 48,911 | 0.41% |
| Trimegah Bangun Persada Tbk PT | $137,808.33 | NCKL IJ | BP69061 | 3,307,400 | 0.37% |
| MMG Ltd. | $129,531.14 | 1208 HK | 6728793 | 355,920 | 0.35% |
| Avino Silver & Gold Mines Ltd. | $129,646.16 | ASM | B05P311 | 66,146 | 0.35% |
| Encore Energy Corp. | $131,391.03 | EU CN | BN48958 | 94,486 | 0.35% |
| Lithium Argentina AG | $123,919.40 | LAR | BS2CSN8 | 53,878 | 0.33% |
| Jupiter Mines Ltd. | $119,989.28 | JMS AU | BF4J2C3 | 1,154,115 | 0.32% |
| Sungeel Hitech Co. Ltd. | $114,338.35 | 365340KS | BP2SMJ9 | 4,900 | 0.31% |
| Sayona Mining Ltd. | $101,925.67 | SYA AU | BBX4LR9 | 8,513,744 | 0.27% |
| Hindustan Copper Ltd. | $96,451.74 | HCP IN | B02GZ11 | 37,030 | 0.26% |
| Taseko Mines Ltd. | $98,517.06 | TGB | 2592066 | 40,542 | 0.26% |
| NGEx Minerals Ltd. | $88,262.12 | NGEX CN | BKDKBL4 | 9,186 | 0.24% |
| Syrah Resources Ltd. | $80,458.40 | SYR AU | B23HV20 | 500,751 | 0.22% |
| Core Lithium Ltd. | $79,060.29 | CXO AU | B4XFS83 | 1,568,408 | 0.21% |
| Standard Lithium Ltd. | $79,176.48 | SLI | BF0QWN9 | 58,218 | 0.21% |
| Bannerman Energy Ltd. | $73,315.12 | BMN AU | B07DXJ1 | 48,684 | 0.20% |
| Lifezone Metals Ltd. | $74,699.70 | LZM | BLCY1J2 | 16,490 | 0.20% |
| ERO Copper Corp. | $68,851.75 | ERO CN | BF02Z72 | 5,269 | 0.18% |
| ioneer Ltd. | $68,706.59 | INR AU | BGYBHZ4 | 703,489 | 0.18% |
| Meteoric Resources NL | $67,729.55 | MEI AU | B01CRT2 | 1,580,738 | 0.18% |
| Americas Gold & Silver Corp. | $64,153.41 | USAS | BK7CQM2 | 116,685 | 0.17% |
| IsoEnergy Ltd. | $55,738.09 | ISO CN | BTTRKM6 | 9,200 | 0.15% |
| Uranium Royalty Corp. | $51,186.80 | UROY | BL7BHH8 | 28,280 | 0.14% |
| ATALAYA MINING COPPER SA | $47,077.93 | ATYM LN | BYZTVM8 | 9,786 | 0.13% |
| Lotus Resources Ltd. | $50,004.99 | LOT AU | BK6XLC1 | 466,826 | 0.13% |
| New Pacific Metals Corp. | $47,873.70 | NEWP | BMX73Y6 | 37,995 | 0.13% |
| Talga Group Ltd. | $50,156.39 | TLG AU | B59N8P5 | 173,045 | 0.13% |
| Northern Dynasty Minerals Ltd. | $42,617.24 | NAK | B014QY6 | 36,739 | 0.11% |
| Piedmont Lithium Inc. | $40,989.80 | PLL | BMGHM13 | 6,220 | 0.11% |
| Patriot Battery Metals Inc. | $39,810.43 | PMT AU | BP2VWP4 | 217,866 | 0.11% |
| American Battery Technology Co. | $35,433.04 | ABAT | BQC80B4 | 30,028 | 0.10% |
| Ivanhoe Electric Inc. / US | $35,949.99 | IE | BPF0KH6 | 5,279 | 0.10% |
| Silver Mines Ltd. | $38,316.25 | SVL AU | B1HMJH5 | 608,098 | 0.10% |
| MAC Copper Ltd. | $35,313.96 | MTAL | BQBC846 | 3,452 | 0.09% |
| Global Atomic Corp. | $28,687.68 | GLO CN | BF11BK3 | 76,025 | 0.08% |
| Renascor Resources Ltd. | $29,062.14 | RNU AU | B3M6XR4 | 1,024,957 | 0.08% |
| Central Asia Metals PLC | $24,867.33 | CAML LN | B67KBV2 | 11,230 | 0.07% |
| Kodal Minerals PLC | $26,041.71 | KOD LN | BH3X7Y7 | 5,156,458 | 0.07% |
| Solaris Resources Inc. | $25,065.29 | SLS CN | BMQ5701 | 7,117 | 0.07% |
| Jinchuan Group International Resources Co. Ltd. | $23,670.33 | 2362 HK | 6373988 | 287,600 | 0.06% |
| FireFly Metals Ltd. | $24,153.85 | FFM AU | BPDXXB2 | 38,526 | 0.06% |
| Atlas Lithium Corp. | $18,599.10 | ATLX | BMD4B09 | 3,263 | 0.05% |
| Galan Lithium Ltd. | $18,616.45 | GLN AU | BG5PWD8 | 268,593 | 0.05% |
| Peninsula Energy Ltd. | $19,781.58 | PEN AU | 6486381 | 44,531 | 0.05% |
| Trilogy Metals Inc. | $14,817.60 | TMQ | BD89HT7 | 8,820 | 0.04% |
| SolGold PLC | $10,870.17 | SOLG LN | B0WD0R3 | 114,990 | 0.03% |
| Aeris Resources Ltd. | $5,435.22 | AIS AU | BZ8W0K2 | 41,076 | 0.01% |
| Leo Lithium Ltd. | $3,567.94 | LLL AU | BPX2X20 | 23,792 | 0.01% |
| Cash Equivalent | $109,820.80 | $109,820.80 | 0.29% |
95 total, excluding cash and cash equivalents. Subject to change.
Distributions
Ex-Date |
Record Date |
Payable Date |
Short-Term Capital Gains |
Long-Term Capital Gains |
Ordinary Income |
Total Distributions |
12/14/2023 |
12/15/2023 |
12/21/2023 |
$0.01 |
- |
$0.43 |
$0.44 |
12/12/2024 |
12/12/2024 |
12/19/2024 |
- |
- |
$0.31 |
$0.31 |
Literature
Fact Sheet
Quarterly Investor Presentation
Index Rebalance
White Paper
FAQs
Regulatory Documents
- Annual Reports Financial Statements and Other Important Information, December 31, 2024
- Tailored Shareholder Report, December 31, 2024
- Tailored Shareholder Report, June 30, 2024
- Semi-Annual Financial Statements and Other Important Information, June 30, 2024
- Summary Prospectus
- Statutory Prospectus
- Statement of Additional Information
- Annual Report, December 31, 2023
Commentary
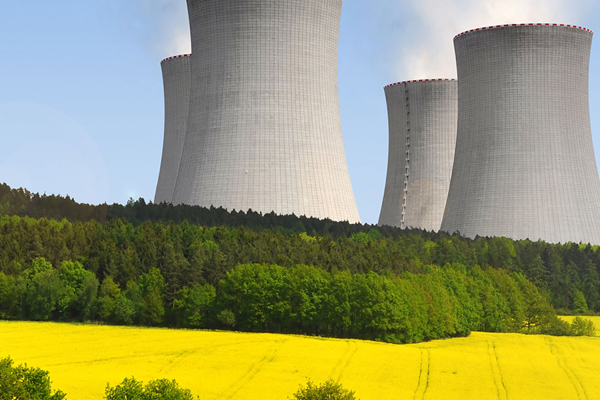
Tariffs, Tensions and the Uranium Opportunity
BY JACOB WHITE · 3/10/2025
We see market volatility as an opportunity, with uranium’s spot price offering an attractive entry point for investors. Despite Trump tariff policy and geopolitical uncertainties, uranium’s strong long-term fundamentals—supply deficits and rising nuclear demand—remain intact.

Critical Materials Markets Shake Off DeepSeek Disruption and U.S. Policy Rollbacks
BY JACOB WHITE · 2/24/2025
Critical materials showed resilience in January amid global volatility. We take a deep dive into China's growing leadership in clean technology investments, the disruptive impact of DeepSeek's AI model and the implications of U.S. policy changes on the energy transition and critical materials supply chains.

The Era of Critical Materials: Powering Our Planet Toward a Brighter Future
We explore the essential minerals driving the energy revolution, from copper's role in electrification to uranium's impact on nuclear power, and the rise of battery storage technology. Join us on a journey through the periodic table to understand how these critical materials are needed to meet the rising global demand for energy.
How to Purchase
Invest Now
Sprott ETFs are liquid, convenient investments that can be purchased like any regular stock through discount and full-service brokers. You can purchase and trade shares of Sprott ETFs directly through your online brokerage firm; these firms may include:
U.S. Investors


Canadian Investors


Contact Us
Investment Adviser
Sprott Asset Management USA, Inc.
320 Post Road, Suite 230
Darien, CT 06820
Telephone: 888.622.1813
Distributor and Sub-Adviser
ALPS
1290 Broadway, Suite 1100
Denver, CO 80203
Client Services
Financial Advisors and Investors
Telephone: 888.622.1813
Email: bullion@sprott.com
Standard Mail
Sprott ETFs
P.O. Box 1107
Denver, CO 80201
Overnight Mail
Sprott ETFs
1290 Broadway
Suite 1100
Denver, CO 80203